Aleksandra Szlęk 28.489
supervisor:
dr Bogna Otto-Węgrzyn
Academy of Fine Arts in Katowice
Faculty of Art
Faculty of Art
biography
born in 1994
diploma in the Artists Book Studio, Faculty of Arts, Academy of Fine Arts in Katowice. Her main areas of interest range from graphics and an art book to draw. She often works at the in-between art and design. The areas of ideological interest mainly include the analysis of her own experiences, finding universal content among them and values in them, and translating them into the language of art. Her main sources of inspiration are melancholy and a sense of humor.
Number of individual exhibitions: 2.
Number of collective exhibitions: 25.
The most important awards: Łaźnia Center for Contemporary Art Award, Best Diplomas of the Academy of Fine Arts - 2019 Award of the Dean of the Faculty of Arts - Fairy Tales of the Robots Miniature Print Competition - 2018 Grand Prix - together with the co-authors of the WAR exhibition, 47th FAMA Festival - 2017 Scholarship of the Minister of Culture and National Heritage - 2019 Rector's scholarship for the best students of the Academy of Fine Arts in Katowice - 2015-2019
self-commentary
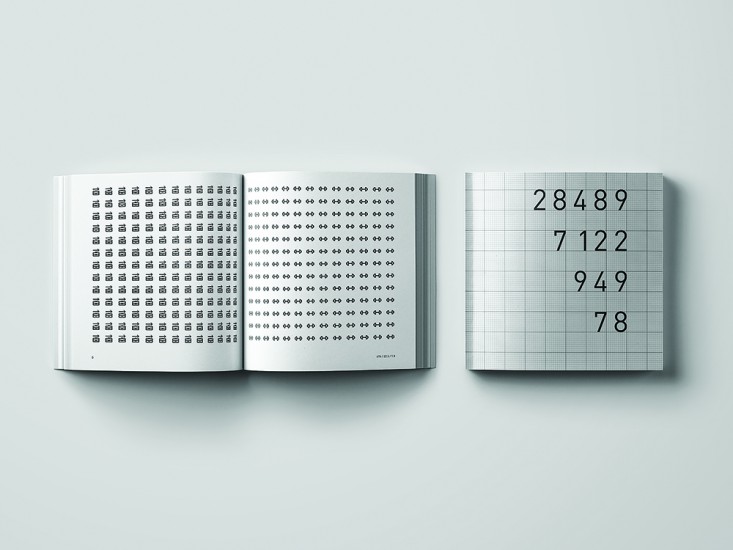
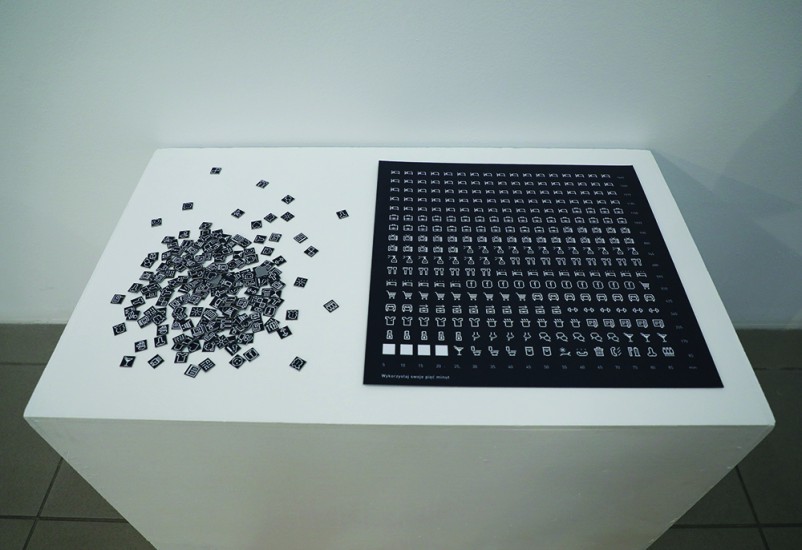
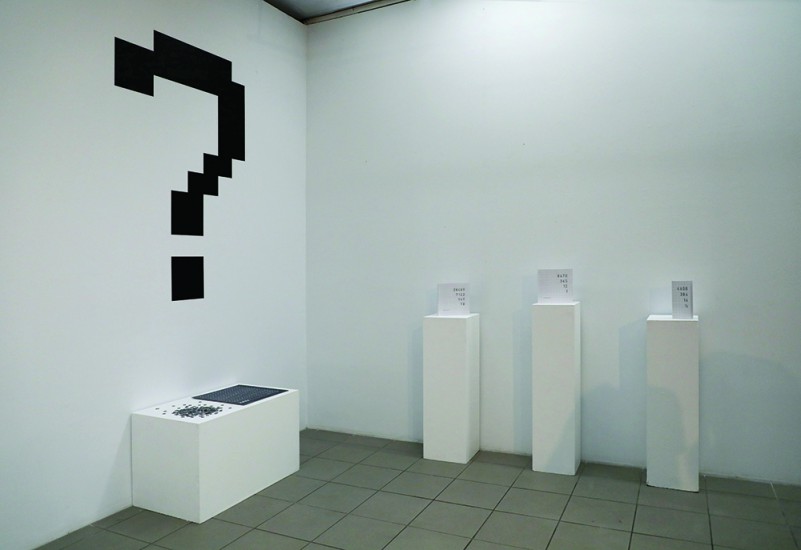
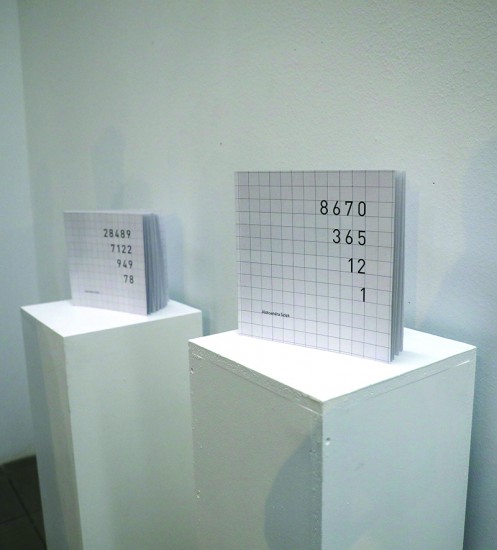
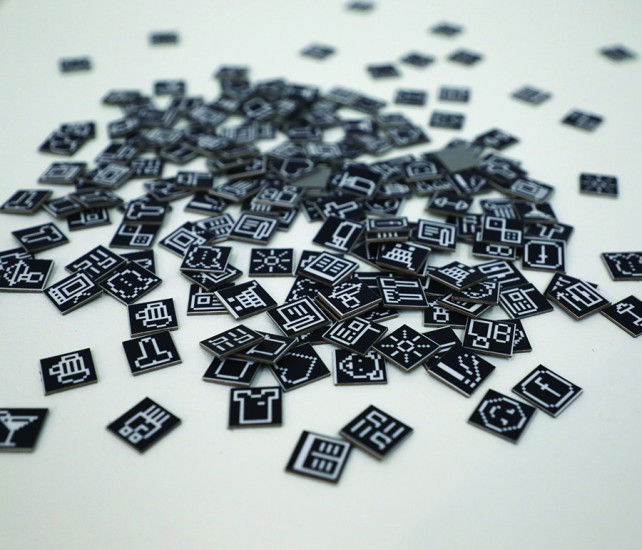
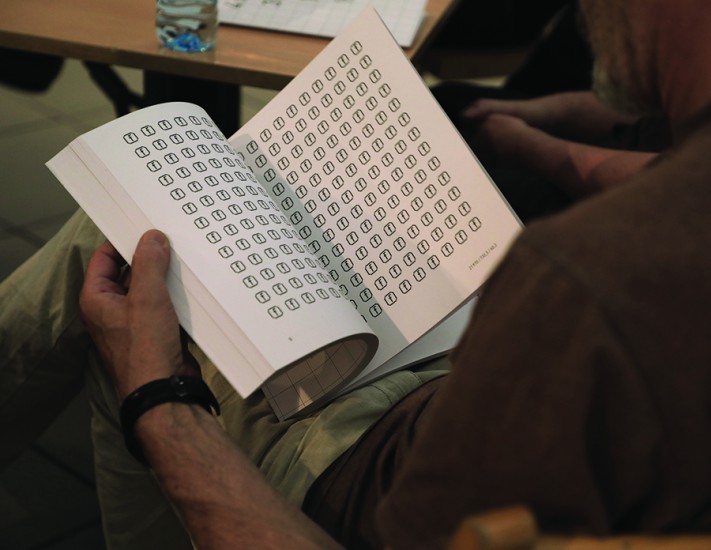
78 years equals 28,489 days. The average human lifespan shown as days seems to be a surprisingly small number. Moreover - almost one-third of our lives we spent sleeping. Professional work is at least 12%. Time spent in front of TV and computer screen is another 10%. How much time do we have left for what we really want to call life? The first part of the book is a series of 28,489 pictograms representing all the days of our life and the activities filling our existence. The second part of the book is more about proportions - I compare the duration of particular activities. The last quasi-interactive part of the project is dedicated to the viewers – it is a board they can "fill in" on their own. The data used in the project is based on GUS research. The purpose of statistical analysis is to extract information that I would call "average truth". As an artist, when interpreting statistics graphically, I try to find „gaps of meaning” among the graphs and bars.